Home
Product
About Givily
Resources
Our Blog
Our Impact
Contact Us
Sign In
0
No products in the cart.
Infographics-are-visual-representations-of-data-making-complex-info-easier-to-share-and-digest.-When-making-your-own-simply-organize-your-images-charts-and-text.-Finally-cite-your-sources.
Home
Uncategorized
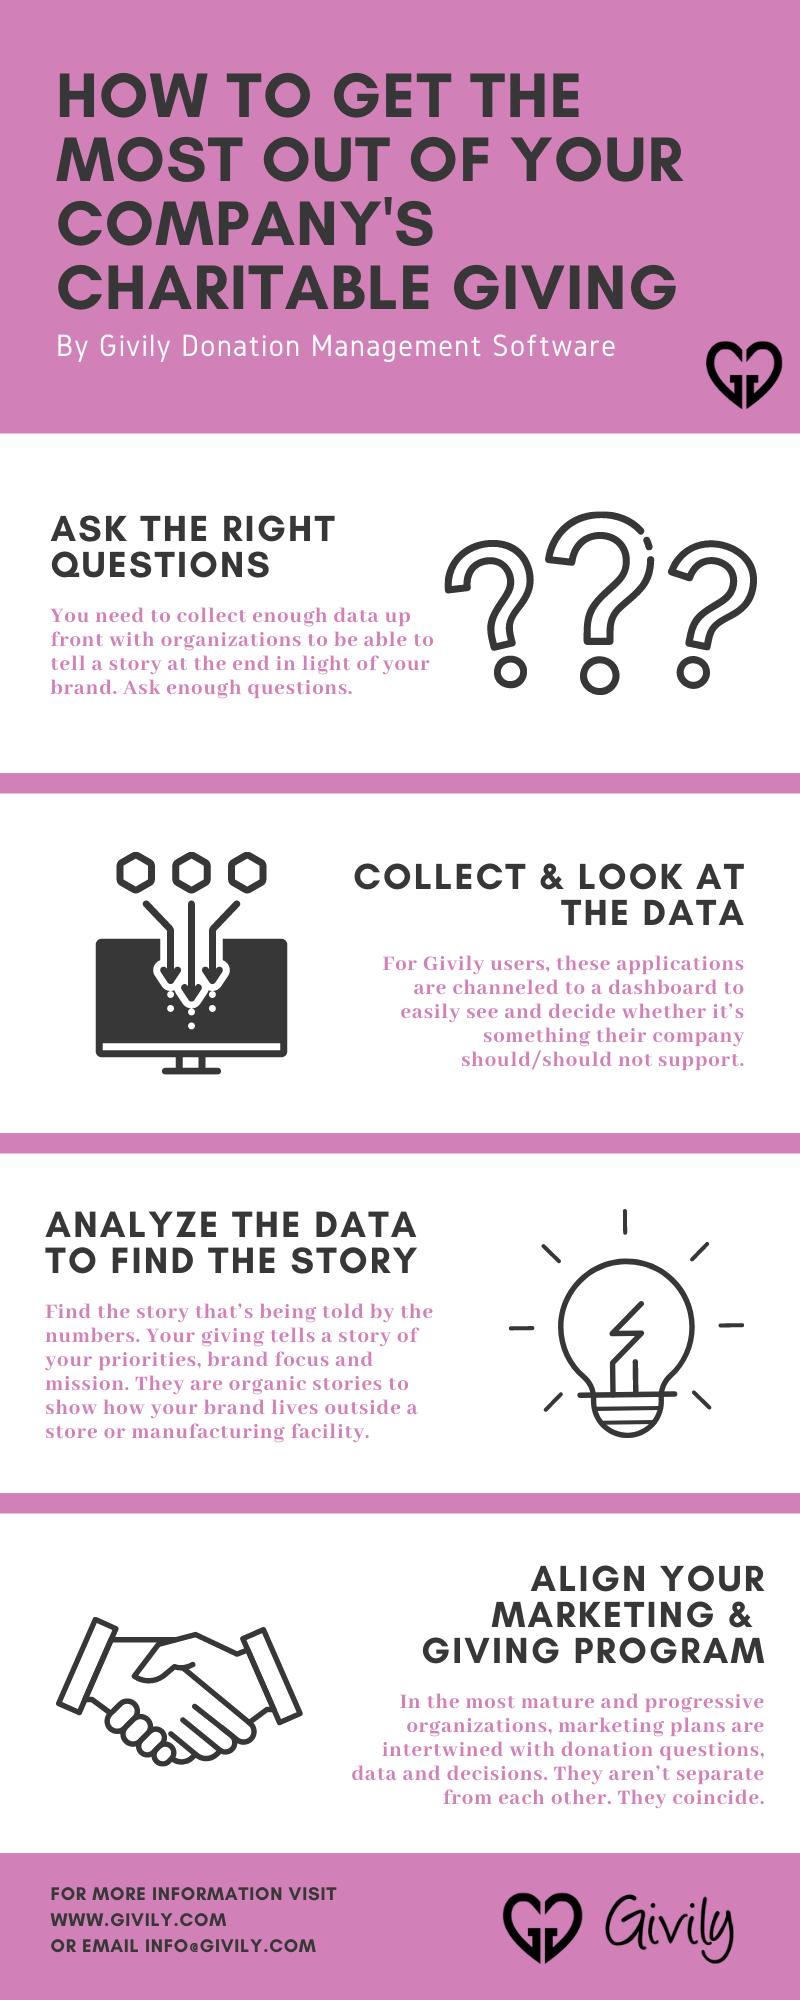
How To Get The Most Out Of Your Corporate Giving
Infographics-are-visual-representations-of-data-making-complex-info-easier-to-share-and-digest.-When-making-your-own-simply-organize-your-images-charts-and-text.-Finally-cite-your-sources.
Jul 14, 2020
Post by
Brittany Bantle
0 Comment
brittany
Write A Comment
Cancel Reply
You must be
logged in
to post a comment.
Post navigation
Published in
How To Get The Most Out Of Your Corporate Giving